1. General Description of the Feature
The Seattle Fault Zone is located in the Seattle metropolitan area in the state of Washington in the United States of America. The approximate location is shown in the embedded Google Map below. The zone is shown within the two dashed lines in Figure 1.1. and is composed of four south dipping thrust faults (Johnson et al., 1994). It is composed of one major fault of a length reaching 45 km - shown in Figure 2.3. - and additional smaller ones. A thrust fault is a type of contractional fault with a low dip angle where the hanging wall relative to the footwall is going up (Fossen, 2010). In this particular case, the Seattle Fault has a high dip angle close to the surface and a low dip value as the fault goes deeper. It falls into the thrust fault cathegory of contractional faults. The faults in the zone trend east-west and are believed to have caused a major earthquake around 900 A.D. which had a magnitude over 7 on the Richter scale (Calvert et al., 2001). Because of this event and the fact that the faults have been active in the past 30 years - according to recent studies - the zone is believed to represent a major seismic hazard (Johnson et al., 1994). The fault zone has been heavily studied in the last 40 years as it goes directly under the City of Seattle - which is the biggest city in the State of Washington (Information Please, 2007). The exact model describing the relation and motion between the various features is still debated among geologists today (Nelson 2014).
The Seattle Fault Zone is located in the Seattle metropolitan area in the state of Washington in the United States of America. The approximate location is shown in the embedded Google Map below. The zone is shown within the two dashed lines in Figure 1.1. and is composed of four south dipping thrust faults (Johnson et al., 1994). It is composed of one major fault of a length reaching 45 km - shown in Figure 2.3. - and additional smaller ones. A thrust fault is a type of contractional fault with a low dip angle where the hanging wall relative to the footwall is going up (Fossen, 2010). In this particular case, the Seattle Fault has a high dip angle close to the surface and a low dip value as the fault goes deeper. It falls into the thrust fault cathegory of contractional faults. The faults in the zone trend east-west and are believed to have caused a major earthquake around 900 A.D. which had a magnitude over 7 on the Richter scale (Calvert et al., 2001). Because of this event and the fact that the faults have been active in the past 30 years - according to recent studies - the zone is believed to represent a major seismic hazard (Johnson et al., 1994). The fault zone has been heavily studied in the last 40 years as it goes directly under the City of Seattle - which is the biggest city in the State of Washington (Information Please, 2007). The exact model describing the relation and motion between the various features is still debated among geologists today (Nelson 2014).
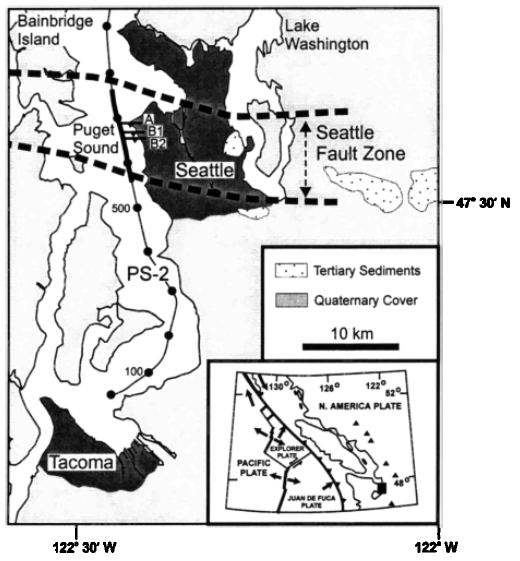 Figure 1.1. Map of the region which shows an approximation of where the Seattle Fault Zone is located. The zone is within the two dashed lines in the upper part of the image. Adapted from Calvert et al., 2001. |
| The Seattle Fault Zone is an area that is experiencing contraction, where there is a shortening on the North-South axis (Johnson et al., 1994). The dextral faults on the north and south side of the zone would be the cause this shortening. The area is acting as a restraining transfer zone between the dextral faults (Johnson et al., 1994). The dextral faults would be caused by the subduction of the Juan de Fuca plate and a clockwise rotation of the Cascade arc (more details in section 3). The presence of the faults in the metropolitan area was first mentioned in a 1965 study of the region (Calvert et al., 2001) and is believed to have its origins in late Eocene (40 Ma ago) (Johnson et al., 1994). | 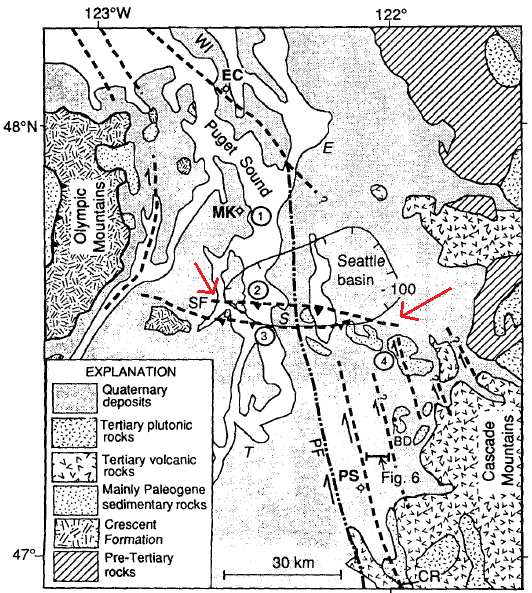 Figure 1.2. A geological map of the region with the Seattle Basin circled in the middle. The legend of on the lower left corner identifies the various rock types present in the region. The major fault is identified with two red arrows. Adapted from Johnson et al., 1994. |
| The region is composed of a thick layer of Quaternary deposits shown in Figure 1.2. A high resolution geological map of the region is available at this location - a link is provided as there is too much details to be embedded on the web site. | 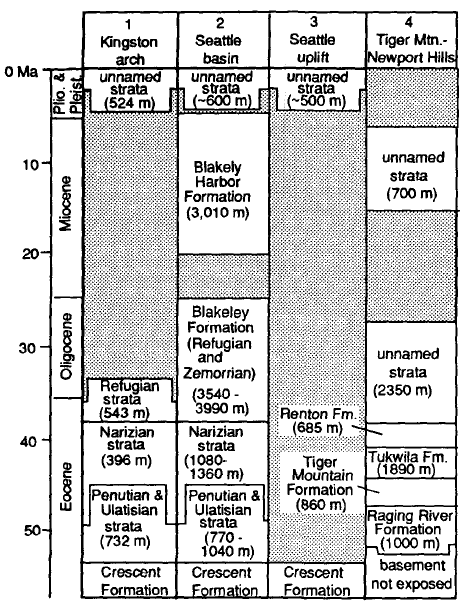 Figure 1.3. A stratigraphic chart of four different locations in the Seattle Fault Zone. The age and rock unit thickness are labelled on the diagram. Adapted from Johnson et al., 1994. |
Figure 1.3 shows the rock units along with their age present at four different locations in the Seattle Fault Zone. The oldest unit shown on the diagram is the Crescent Formation which is made of marine basalt and sedimentary rocks (Johnson et al., 1994). The shaded areas on the chart are sections where the strata was not preserved. On top of the Crescent Formation, layers of sandstone, siltstone and shale are present up until the Narizian strata. The Refugian to Zemorrian strata mark the boundary between marine sedimentary rocks to nonmarine sedimentary rocks (Johnson at al., 1994). The Oligocene portion of the Blakely Formation contains layers of sandstone, siltstone, shale, and conglomerate from a deep-marine environment, and the same types of rocks are found up to the late Miocene era - with the exception that there is no presence of shale (Johnson at al., 1994).
2. Detailed Description of the Structures
The Seattle Fault Zone is defined by 4 south-dipping faults crossing the metropolitan area (Johnson et al., 1994). The faults are shown in Figure 2.1. where they are labeled from 1 to 4. There is one major faults - labelled 3 in Figure 2.1. - and additional smaller faults. The motion of the hanging wall relative to the footwall of the faults is going upward as they are thrust faults. They have dips varying from 65 to 70 degrees near the surface (Johnson et al., 1994). The faults are believed to have dips around 20 degrees at greater depth (Calvert et al., 2001).
The Seattle Fault Zone is defined by 4 south-dipping faults crossing the metropolitan area (Johnson et al., 1994). The faults are shown in Figure 2.1. where they are labeled from 1 to 4. There is one major faults - labelled 3 in Figure 2.1. - and additional smaller faults. The motion of the hanging wall relative to the footwall of the faults is going upward as they are thrust faults. They have dips varying from 65 to 70 degrees near the surface (Johnson et al., 1994). The faults are believed to have dips around 20 degrees at greater depth (Calvert et al., 2001).
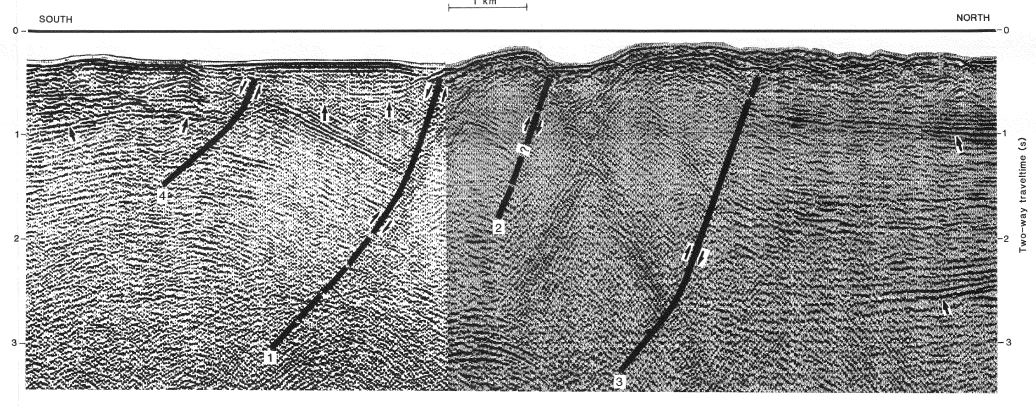
Figure 2.1. A cross-section of one of the interpretations of the Seattle Fault Zone where the four south-dipping faults are visible. The north side of the zone is on the right side of the graph, and the south side of the zone is on the left side of the graph. The numbers on the Y-axis represent the roundtrip time in seconds of the signal they sent to determine the composition of the ground. Adapted from Johnson et al., 1994.
Figure 2.2. shows the four faults along with their projection underground. The different layers are also visible on the image. The faults are listric, and the master ramp is along the northernmost fault - labelled 3 (Jonhson et al., 1994).
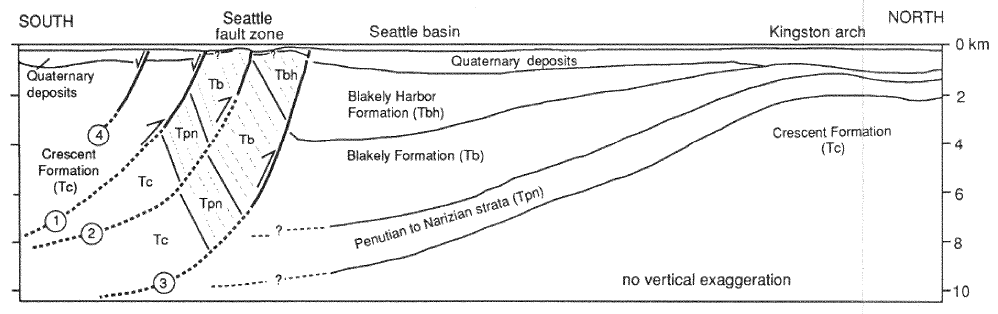
Figure 2.2. The four south dipping thrust faults of the Seattle Fault Zone along with their projection underground. Adapted from Jonhson et al., 1994.
The Seattle Fault Zone is subject to many interpretations, but the four main ones are shown in Figure 2.2. below. The diagrams A, C, and D mainly show the area close to the master fault - and the surface - whereas diagram B includes the potential relation between the Seattle Fault and the Tacoma Fault (Nelson et al. 2014).
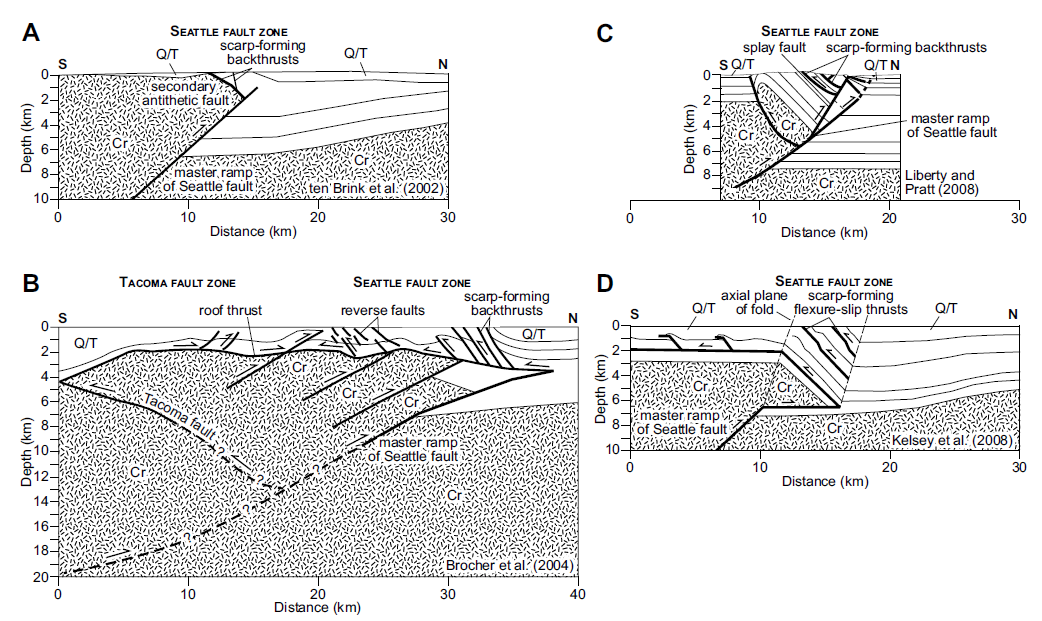
Figure 2.2. The four main models that describe the Seattle Fault along with the various other faults formed by the motion on the fault's master ramp. Adapted from Nelson et al., 2014.
The Seattle Fault Zone contains one major fault that is shown in Figure 2.3. below. The dips and displacement measured along the fault are shown in Table 2.1. The Seattle Fault and Tacoma Fault have a particular relationship as they would be connected and would be forming the boundaries of the Seattle uplift. The Tacoma Fault is composed of multiple faults and folds that are north dipping and east-west striking (Nelson, 2014). If the suggested model where the Tacoma and Seattle faults are connected, and form the Seattle uplift boundaries is right, they would do so at a distance of at least 10 km underground (Nelson 2014).
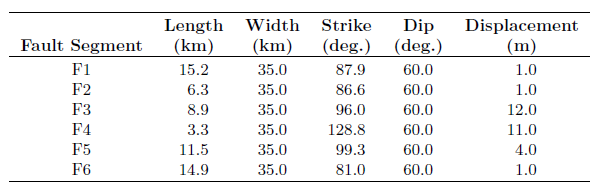
Table 2.1. The measurements taken along the Seattle Fault shown in Figure 2.3. above. Adapted from Venturato et al., 2007.
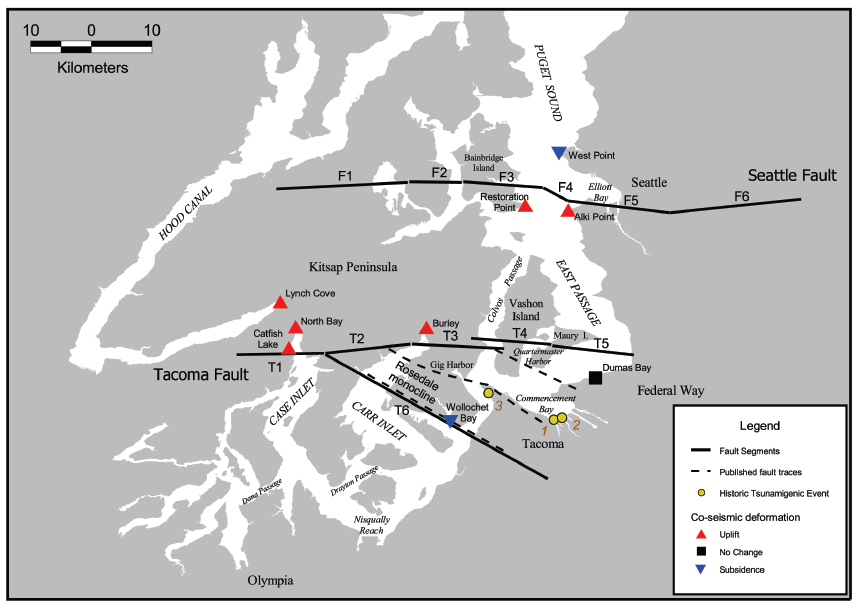
Figure 2.3. A map showing the various faults in the region. The major fault of the zone is identified as the "Seattle Fault". Adapted from Venturato et al., 2007.
| 3. Discussion of the Deformation and Motion The Seattle Fault Zone is experiencing stress from various sources: the subduction of the Juan de Fuca Plate, and the rotation of the Cascade arc. A subduction zone is when two edges of a tectonic plate contact and one goes underneath the other. In this case, the Juan de Fuca Plate goes underneath the Washington state - the North American plate - at a rate of approximately 40 mm/year (Parsons et al., 1999). This movement is creating a clockwise rotation of the Cascade arc (shown in Figure 3.1. on the right) (Parsons et al., 1999). These motions create multiple dextral faults around the Seattle Fault Zone (North and South), which generates restraining bend in the zone. The restraining bend then creates a positive flower structure, which is composed of multiple reverse faults (Fossen, 2010). An example of a positive flower structure is shown in Figure 3.3. A model in Figure 3.2. shows the kinetics creating the shortening in the Seattle Fault Zone. | 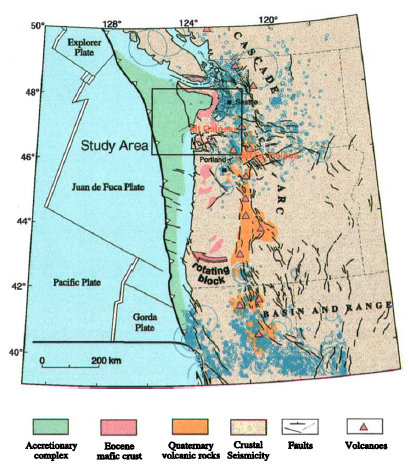 Figure 3.1. The overall tectonic setting of the north-west of the United States of America. Adapted from Parsons et al., 1999. |
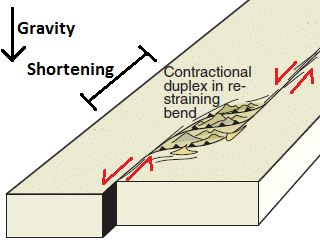 Figure 3.2. A model showing two strike-slip faults creating a restraining bend which illustrates what could be causing the Seattle Fault. Adapted from Fossen, 2010. | 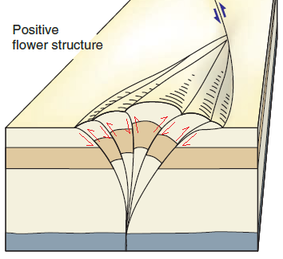 Figure 3.3. A positive flower structure created within a restraining zone. This is one interpretation of the Seattle uplift. The Seattle Fault (south dipping) connects with the Tacoma Fault (north dipping) and uplifts - in a positive flower like structure - what is in between. Adapted from Fossen, 2010. |
These motions results in a current slip-rate of the Seattle Fault equal to 0.5 mm/year, which is believed to be twice the average value it has been in the past 40 millions years (Calvert et al., 2001). The tectonic configuration of the Seattle Fault Zone is shown in Figure 3.2. below. The motion is believed to have started in the late Eocene period and continues to this day.
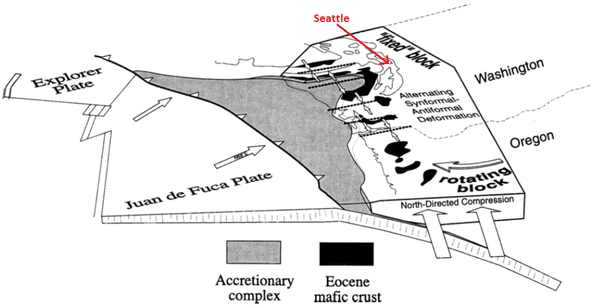
Figure 3.4. The tectonic setting of the Seattle Fault Zone where the Juan de Fuca Plate is going under the basement rock of Washington (the North American plate). Additional forces coming from the south are affecting the zone. The Seattle's location is identified with a red arrow on the image. Adapted from Parson et al., 1999.
4. Graphics and Media
2 Minute Geology video about the Seattle Fault. It discuss the basic tectonic activities along with the tsunami believed to have ravaged the Seattle area in 900 A.D.
2 Minute Geology video about the Seattle Fault. It discuss the basic tectonic activities along with the tsunami believed to have ravaged the Seattle area in 900 A.D.
Short video explaining the tectonic configuration around the Juan de Fuca plate and its movement. It is relevant as it explains the motion of the Juan de Fuca plate relative to the North American Plate (where the Cascade arc resides) - along with the cause of the motion.
Interesting video on the below showing a computer simulation where the tectonic activity produced an earthquake which generated a tsunami. The tsunami spreads on the shores of the metropolitan area. According the to the video description, the simulated earthquake is of magnitude 7.3 on the Richter scale. This is simply to show that Seattle would suffer major damages if such an earthquake were to happen.
5. References
- Johnson, S., Potter, C., & Armentrout, J. (1994). Origin and evolution of the Seattle fault and Seattle basin, Washington. In Geology (1st ed., Vol. 22, pp. 71-74). Denver, Colorado: Geological Society of America.
- Calvert, A., & Fisher, M. (2001). Imaging the Seattle Fault Zone with high-resolution seismic tomography. In Geophysical Research Letters (12th ed., Vol. 28, pp. 2337-2340). Washington, D.C: American Geophysical Union.
- Nelson, A., Personius, S., Sherrod, B., Kelsey, H., Johnson, S., Bradley, L., & Wells, R. (2014). Diverse rupture modes for surface-deforming upper plate earthquakes in the southern Puget Lowland of Washington State. In Geosphere (4th ed., Vol. 10, p. 769–796). Denver, Colorado: Geological Society of America.
- Parsons, T., Wells, R., Fisher, M., Flueh, E., & Brink, U. (1999). Three-dimensional velocity structure of Siletzia and other accreted terranes in the Cascadia forearc of Washington. In Journal of Geophysical Research (B8 ed., Vol. 104, pp. 18015-18039). Washington, D.C: American Geophysical Union.
- Venturato, A., Arcas, D., Titov, V., Mofjeld, H., Chamberlin, C., & Gonzalez, F. (2007). Tacoma, Washington, tsunami hazard mapping project: Modeling tsunami inundation from Tacoma and Seattle fault earthquakes. In Contribution (Pacific Marine Environmental Laboratory (U.S.)) (Vol. 2984). Seattle, Washington: National Oceanic and Atmospheric Administration.
- Fossen, H. (2010). Structural Geology (1st ed.). Cambridge University Press.
- Information Please. (2007). Information Please page on Profiles of the 50 Largest Cities of the United States, Section: Seattle, Washington. Retrieved March 29, 2015, from the World Wide Web: http://www.infoplease.com/ipa/A0108609.html
 RSS Feed
